MT4 (MetaTrader 4) is one of the most popular trading platforms for forex traders. It offers a wide range of features, including using custom indicators to analyze price movements and identify potential trading opportunities.
This article will explore some of the top MT4 indicators every forex trader should know about. These indicators can provide valuable insights into market trends, momentum, support and resistance levels, and other key factors to help traders make informed trading decisions.

Moving Averages
Moving averages are one of the most commonly used indicators in the forex market and are available on the MT4 platform. They are used to identify trends and to smooth out price movements, making it easier for traders to spot buy and sell signals.
To use moving averages in the MT4 platform, a trader must select the “Insert” tab at the top and select “Indicators” from the dropdown menu. From there, they can choose “Trend” and then “Moving Average” to bring up the settings for the indicator.
Traders can customize the moving average by selecting the period they want. For example, a trader may choose a 50-period moving average to identify long-term trends or a 10-period moving average to identify short-term trends. Traders can also select the moving average they want, such as a simple or exponential moving average.
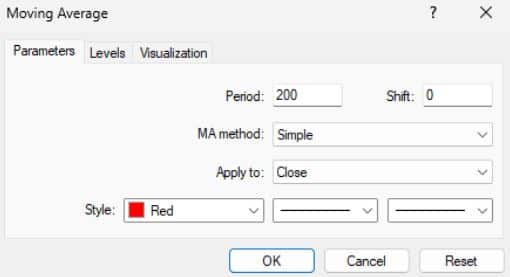
Image 1. The available moving average parameters traders can adjust in the MT4 platform.
CCI
Traders can use CCI to identify potential trend reversals and to confirm trend continuation. When CCI crosses above the +100 level, it may signal a potential trend reversal, indicating that the price may have reached an overbought condition and may be due for a correction.
Conversely, when CCI crosses below the -100 level, it may signal a potential trend reversal to the upside, indicating that the price may have reached an oversold condition and may be due for a rebound.
Traders can also use CCI to confirm trend continuation. When CCI remains above +100 or below -100, it may indicate that the current trend is still strong and likely to continue. In this case, traders may consider entering or adding to positions in the direction of the trend.
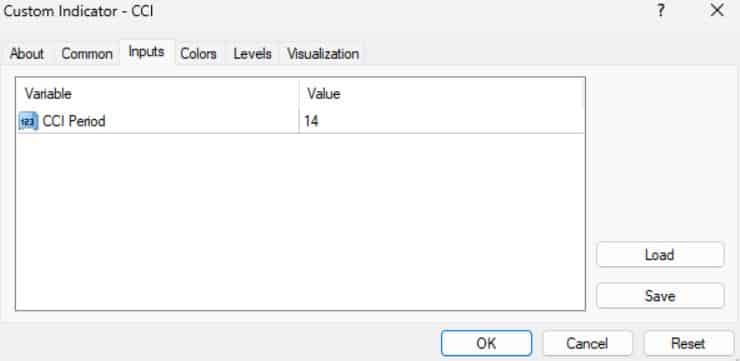
Image 2. The available CCI parameters traders can adjust in the MT4 platform.
OsMa
The OsMA indicator measures the difference between the MACD and signal lines, plotted as a histogram. This means that it is also an oscillator, which can help traders identify overbought and oversold conditions in the market. When the OsMA line is above the zero line, momentum is bullish. In contrast, a line below the zero line indicates bearish momentum.
Traders can use the OsMA indicator in several ways. One way is to look for divergences between the OsMA line and price movements. For example, if the price is making higher highs while the OsMA line is making lower highs, it could be a sign that the uptrend is losing momentum, and a reversal is likely.
Another way to use the OsMA indicator is to look for crossovers of the zero line. When the OsMA line crosses above the zero line, it is a bullish signal, while a cross below the zero line is a bearish signal. Traders can use these crossovers to confirm trends and identify potential trade entry and exit points.
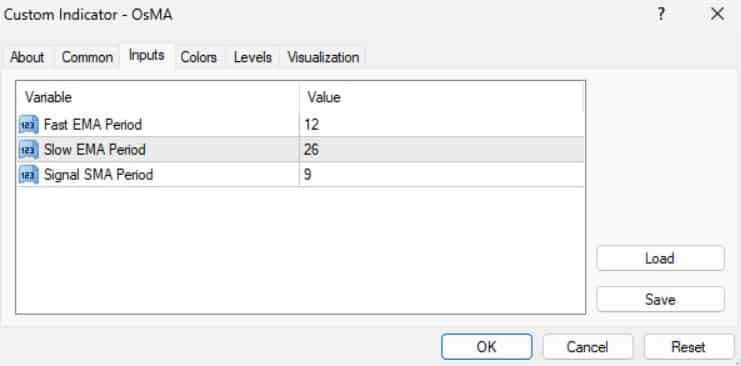
Image 3. The available OsMa parameters traders can adjust in the MT4 platform.
Alligator
Alligator is a trend-following indicator that helps forex traders identify the direction and strength of a trend. It is based on three smoothed moving averages, each shifted into the future by a certain number of bars, and each representing a different period. The three lines are typically colored green, red, and blue to represent the alligator’s jaw, teeth, and lips.
When the three lines are intertwined or close, it indicates that the market is consolidated, and traders should wait for a breakout in either direction. When the green line is above the red line and the red line is above the blue line, it indicates a bullish trend. Conversely, when the green line is below the red line and the red line is below the blue line, it indicates a bearish trend.
Traders can use the alligator indicator in a variety of ways. For example, they can use it to confirm a trend before entering a trade or to identify potential reversal points. They can also use it with other technical indicators, such as oscillators or moving averages, to further refine their trading strategy.
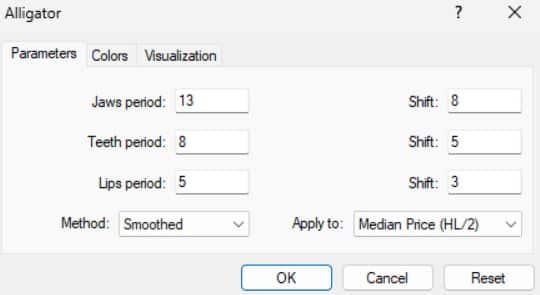
Image 4. The available alligator parameters in the MT4 platform